Case analysis
美国PYTHON代写 Family is a discrete variable, with number ranged in [1,2,3,4]. All the other variables are continuous variables.
Part (a) Data Cleaning and Basic Data Exploration
I have imported the excel data using pandas library in python. The basic descriptive statistics for columns with numerical data is shown in the table below:
| Age | Experience | Income | Family | CCAvg | Mortgage | Personal Loan | Brokerage Account | GIC Account | Online | CreditCard | |
| count | 4499 | 4499 | 4499 | 4499 | 4499 | 4499 | 4499 | 4499 | 4499 | 4499 | 4499 |
| mean | 47.2683 | 77.2683 | 74.3034 | 2.39809 | 1.95183 | 56.0856 | 0.10669 | 0.108691 | 0.0649033 | 0.592132 | 0.296733 |
| std | 11.4547 | 11.4547 | 46.3106 | 1.14704 | 1.75648 | 101.788 | 0.308754 | 0.311286 | 0.246383 | 0.491493 | 0.456868 |
| min | 25 | 55 | 8 | 1 | 0 | 0 | 0 | 0 | 0 | 0 | 0 |
| 25% | 37 | 67 | 39 | 1 | 0.7 | 0 | 0 | 0 | 0 | 0 | 0 |
| 50% | 47 | 77 | 64 | 2 | 1.6 | 0 | 0 | 0 | 0 | 1 | 0 |
| 75% | 57 | 87 | 99 | 3 | 2.6 | 99.5 | 0 | 0 | 0 | 1 | 1 |
| max | 69 | 99 | 224 | 4 | 10 | 617 | 1 | 1 | 1 | 1 | 1 |
From the descriptive statistics, we can see that there are a few binary data:
- Personal Loan
- Brokerage Account
- GIC Account
- Online
- Credit Card
Family is a discrete variable, with number ranged in [1,2,3,4]. All the other variables are continuous variables. From the distribution of the data, we observed that little clients have mortgages, and their income are more likely to be in power-law distribution (skewed) rather than normal.
Part (b) visualization 美国PYTHON代写
Visualization 1: Correlations between features
The first visualization is the pairwise scatter plot and histogram for the numerical and boolean features.
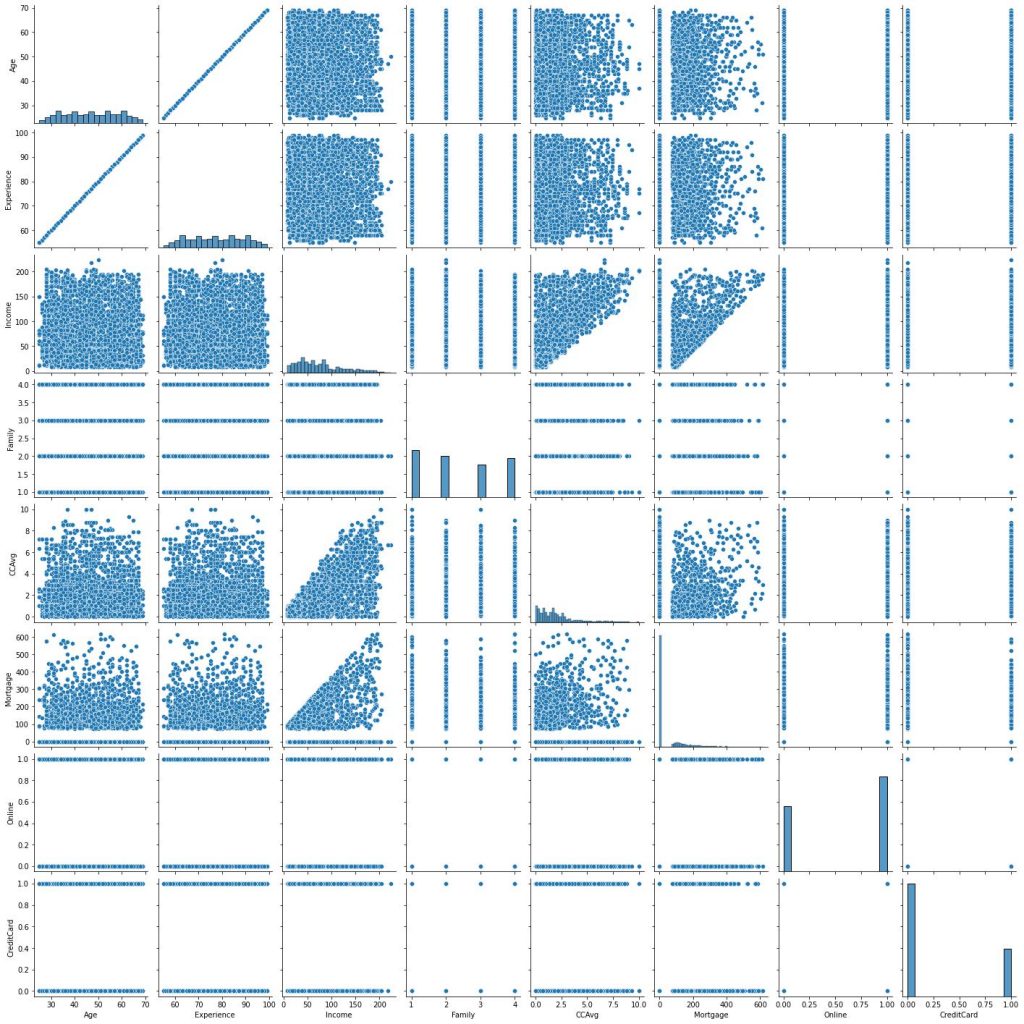
The above is a pairwise scatter plot of some numerical and boolean features. We can see that:
1.Experience and Age are basically correlated perfectly, we will drop one of them.
2.The Income level doesn’t correlate to Mortgage, Family Size and use of other financial products in the bank including credit card.
Visualization 2: features grouped by result
Since we want to see which type of clients are more likely to accept personal loan promotions, we therefore grouped by the result and plotted the distribution for each features above. Note that we saw Experience are highly correlated with Age, then we removed this feature.

Above is the overlayed histogram, grouped by Personal Loan
We can see that:
1.People with higher income are more likely to use Personal Loan.
2.The likelihood of getting a personal loan increases with the family size .
3.People with higher CCAvg are more likely to use Personal Loan.
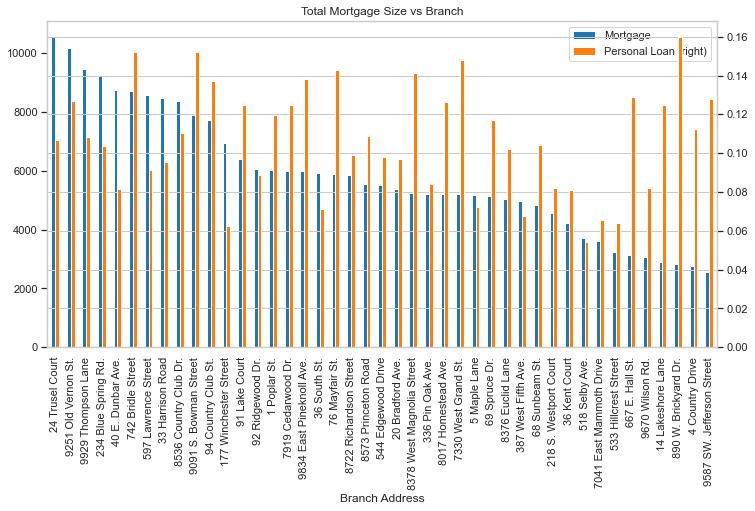
Visualization 3: Does bank branch make a difference
We are also interested in whether some branches are better at promoting personal loans to their clients. Therefore we showed each branch’s total mortgage outstanding, as well as the percentage of clients who accepted the personal loan promotion:
we can see that Branches with larger business volume don’t typically have a higher conversion rate. In fact, the conversion rate is unrelated to the size of their business.
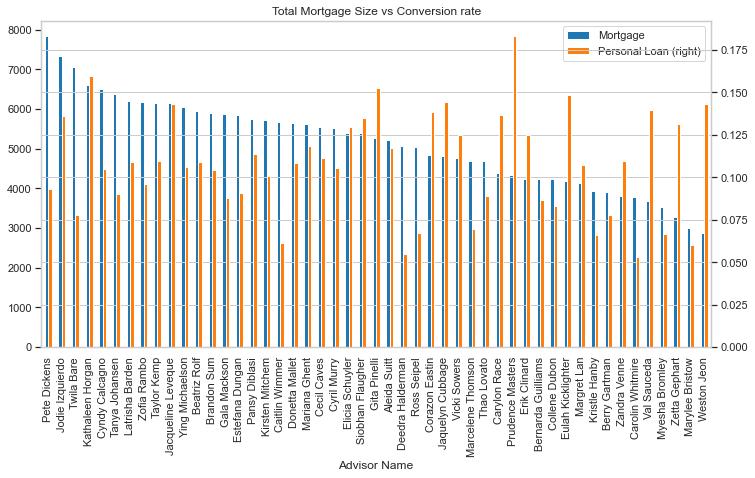
Visualization 4: Does adviser make a difference
The same visualization then applied to advisors.
Similarly, advisors with most clients (in terms of mortgage demand) didn’t have the highest conversion rate as well.
Part (c) Business analytics 美国PYTHON代写
We will group by Advisor name and then calculate how successful each advisor was in terms of:
- selling most Personal Loan products
- highest conversion rate
And below are the 10 most successful advisors by each of the standard
Sold most personal loan products
| Advisor Name | Personal Loan |
| Gita Pinelli | 16 |
| Kathaleen Horgan | 15 |
| Prudence Masters | 15 |
| Jacqueline Leveque | 14 |
| Corazon Eastin | 13 |
| Erik Clinard | 12 |
| Vicki Sowers | 12 |
| Val Sauceda | 12 |
| Siobhan Flaugher | 12 |
| Carylon Race | 12 |
Highest conversion rate
| Advisor Name | Personal Loan |
| Prudence Masters | 0.182927 |
| Kathaleen Horgan | 0.159574 |
| Gita Pinelli | 0.152381 |
| Eulah Kicklighter | 0.148148 |
| Jaquelyn Cubbage | 0.144578 |
| Weston Jeon | 0.142857 |
| Jacqueline Leveque | 0.142857 |
| Val Sauceda | 0.139535 |
| Corazon Eastin | 0.138298 |
| Carylon Race | 0.136364 |
Part (d) Artificial Intelligence 美国PYTHON代写
In this part we will try to fit 3 different models to the data and predict whether a customer will respond positively to a promotion activity and apply for a Personal Loan (Personal Loan).
The features we used are based on historical behavior of the customers:
- Age
- Experience
- Income
- Family
- CCAvg
- Mortgage
- Brokerage Account
- GIC Account
- Online
- CreditCard
And we will classify the customers into Personal Loan = 1 and Personal Loan = 0. The dataset will be randomly split into 80% training set and 20% testing set. Because this result is binary, so we tried 3 different models:
Logistic Regression
The logistic regression model got the following classification result:
precision recall f1-score support
0 0.94 0.98 0.96 802
1 0.70 0.47 0.56 98
accuracy 0.92 900
macro avg 0.82 0.72 0.76 900
weighted avg 0.91 0.92 0.91 900
It has an average accuracy of 92%, which is not bad, however we can see that the recall rate for people who would want a personal loan product is merely 47%. That means we will fail to locate more than half of selling opportunities. 美国PYTHON代写
Support Vector Machine
The SVM model got the following results:
precision recall f1-score support
0 0.90 0.99 0.94 802
1 0.67 0.10 0.18 98
accuracy 0.90 900
macro avg 0.78 0.55 0.56 900
weighted avg 0.88 0.90 0.86 900
The performance of SVC is not as good as logistic regression. It had a strong bias towards personal_loan=0 result.
Random forest
Finally, we tried the random forest model and it appeared to be the best model among the 3:
precision recall f1-score support
0 0.96 0.99 0.97 802
1 0.92 0.62 0.74 98
accuracy 0.95 900
macro avg 0.94 0.81 0.86 900
weighted avg 0.95 0.95 0.95 900
The random forest model performed the best, with on average 95% accuracy and most importantly, 62% recall on people who “would” actually apply for Personal Loan, which is the highest of 3 candidate models.
更多代写:澳大利亚网课代考价格 sat替考 软件工程专业Assignment代写 美国report论文代写 美国大学论文字数 英国大学网课
合作平台:essay代写 论文代写 写手招聘 英国留学生代写